Power Meter and Data logging for under $35. Watts Up?
I was looking around for a decently priced power meter with data logging for my mining rig, and wasn’t having much luck at finding anything. I already own a Kill-A-Watt (P3) which does show me what I wanted on the screen at that moment in time, but I really wanted to have everything logged. Then I stumbled upon the Watts Up? power meter. This seemed to have all the features I wanted. It would data log the info, and I could pull it into a table or I could graph it. It could record a fast as once per second, and track all the stats I was looking for. The main stats I wanted to watch was Watts, and Watt Hours. But this had a lot more features. A few that I really liked were Monthly Average Cost, Cumulated Cost and Monthly Average KWh. You could program in your cost per KWh and see real time your current costs on the meter and what your average monthly cost is.
The Downside:
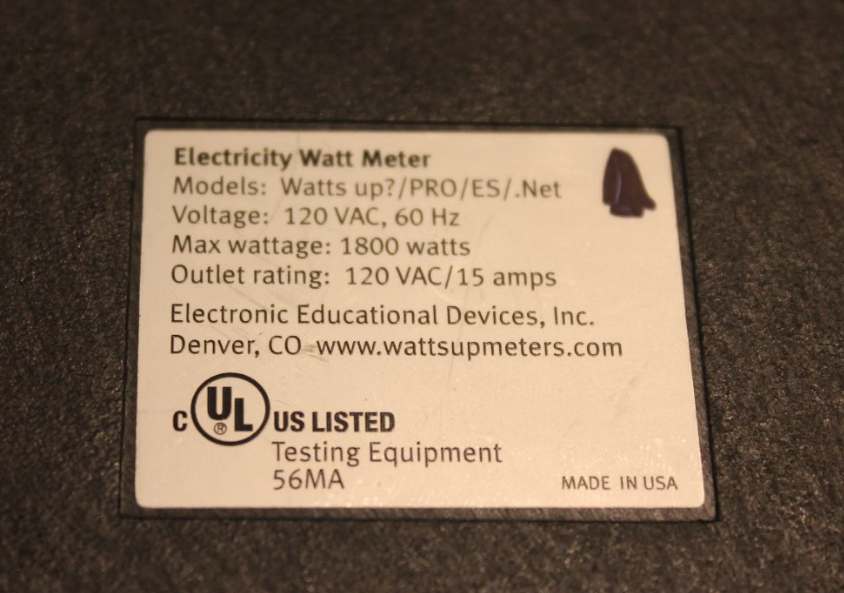
Then came the initial downside. I found out the Watts Up? meter is no longer being made and is discontinued. After seeing the original asking price of the Watts up, I found that this might actually be an upside. Since it is no longer being made or supported I could find these meters used for really cheap. I purchased one of the upper end models the “Watts Up .Net” for under $35 dollars shipped on ebay (The original retail price I saw online was $235.95 for the .net model). They have lots of them for sale used on ebay and the price really varies. I see some of them selling for cheaper then I paid and some were a LOT more expensive, so shop around. Also some come with software and some don’t.
With no support and buying a product used, your mileage may vary. But for $35 bucks I decided to try it out. I want to mention I do see some people posting software for it on Github. But I really haven’t searched much yet to see if there is much of a following for these meters. I also found a Pro version of their software on newegg, but it was kinda spendy. (It looks like the pro version gives you real-time data on your screen instead of having to pull it from the device by clicking retrieve.)
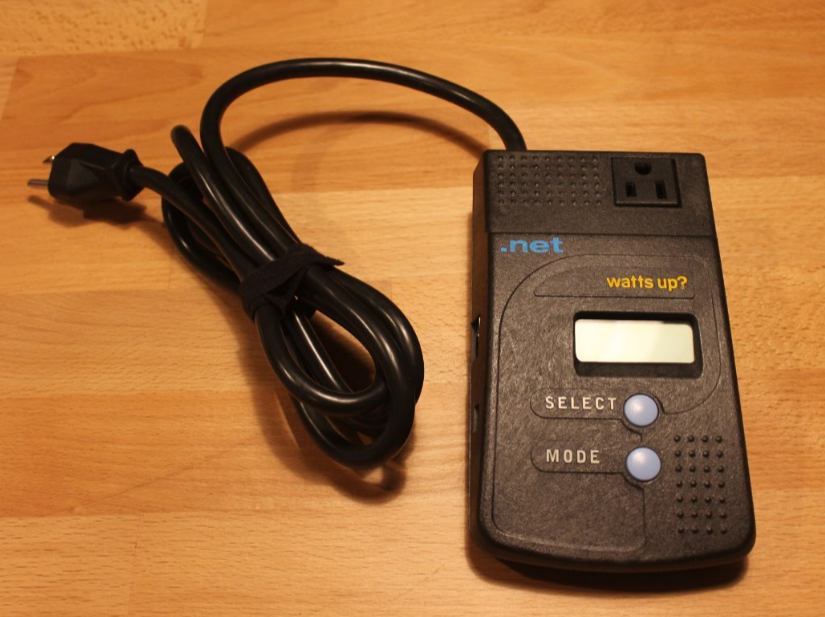
Here is the meter I purchased. The Top-o-the-line Watts up? .net
I found there were 4 different versions being sold of the “WATTS UP?” meter.
Here are some differences and details on why I chose the .NET model.
“Watts Up?” This appears to be the cheapest model. And from what I could see online it does not appear to have a USB port and did not do any Data logging. I think it only displays info like my Kill-A-Watt P3.
“Watts Up? Pro” This did have Data logging and a USB port to to hook up to your PC. It stated it could hold over 2,000 Records with all parameters being measured (and over 30,000 if just watts.) But depending on your sample rate, and if you want to track a few separate indicators, that may not last very long before over writing the data.
“Watts Up? Pro ES” Appears to be the same as the Pro model but with more memory. Able to store up to 8,000 records, or 120,000 if just Watts.
“Watts Up? .NET” This was their top of the line model. It includes an Ethernet connection for internet logging. (It appears watts up used to have a webserver you could connect to, but the link I tried for it is no longer available) But supposedly you can also use it to connect to a Intranet server on your own network which would be really cool. The “.NET” model is supposed to have a built in webserver (From what I can tell so far it’s not a GUI but you can use API’s and uses port 80). It also has Enhanced Data integrity for harsh line loads. The amount of memory is the same as the “PRO ES” model with 8,000/120,000 records capability as mentioned above. But also had an option for extended memory. (I need to check to see if the one I bought has this extra option). Plus a big feature that was listed is POWER SWITCHING 🙂 . Supposedly I should be able to turn the power on/off based on rules. Like peak usage, or cumulative usage, or manually reboot my miner, or just turn it off. Needless to say, this was the version I looked for even if I probably wont use all the features.
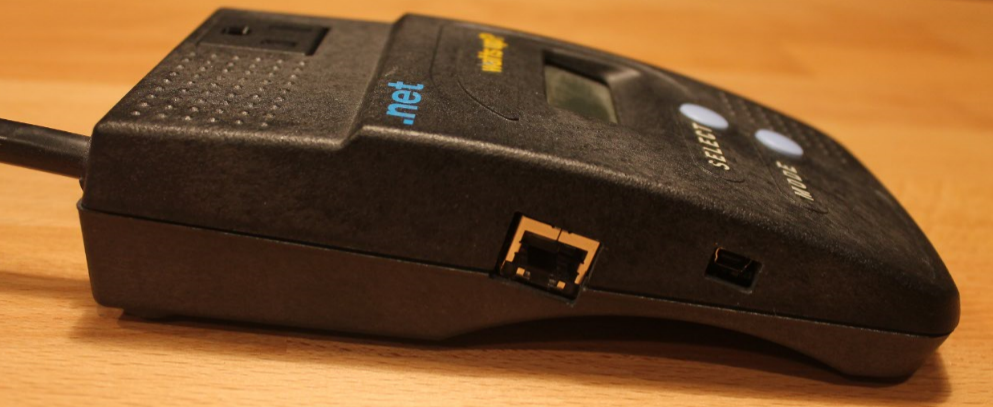
Here is a side view of the Watts Up .NET version showing the Ethernet connection and the USB connection. Unfortunatly the USB connection is a MINI USB. But this is an older device.
The Watts Up? .Net meter records the following 18 parameters.
- Watts
- Volts
- Amps
- Watt Hours
- Cost
- Monthly Average KWhr
- Monthly Average Cost
- Max Watts
- Max Volts
- Max Amps
- Min Watts
- Min Volts
- Min Amps
- Power Factor
- Duty Cycle
- Power Cycle
- Line Frequency
- Volt-Amps
I find it handy as these can be displayed on the meter itself, or you can graph it through the software. The software is not real time. I have to “Request” the data and then it imports it to the computer from the device. This is not an issue for me, but I do see as mentioned earlier they have a Pro version of the software available. I also have not tried any of the webserver capabilities yet.
For the record, I do not have instructions and have just been playing around with it and googling a few things. But it is pretty self explanatory in the units menus. You just use the Mode button to toggle between different modes such as Watts, Amps and Cost. Then you use the select button to view the items under that mode. Only two buttons to deal with. It also seems that you can change the settings on the meter itself. By holding down the select button. But I just used the software. (To change things like my local cost per KWh)
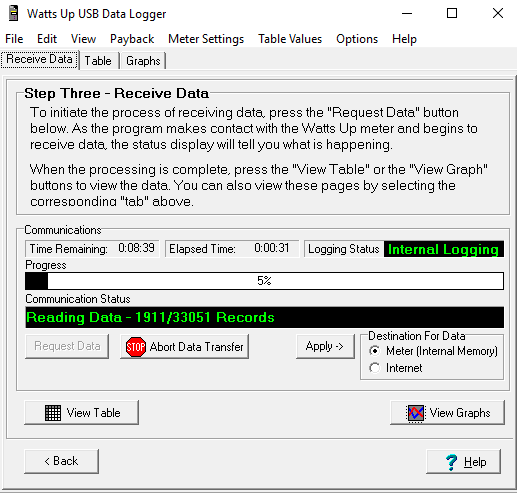
Viewing the data on a PC.
Here I am retrieving the Data that is being stored internally on the device. This is why I think the PRO ES and .NET models are better as they have more memory.
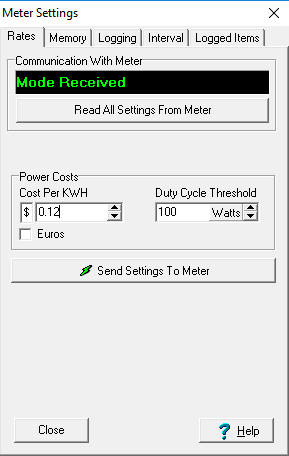
You can go into meter settings and set your cost per KWH.
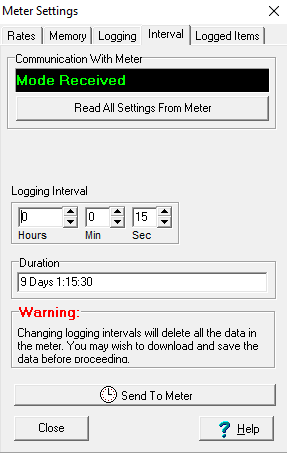
Here you can see where you set your logging interval. I just chose 15 seconds. but have played around with 1 second and 1 minute as well. As you change the interval, you see the duration change as well. The duration also depends on how many parameters you are capturing.
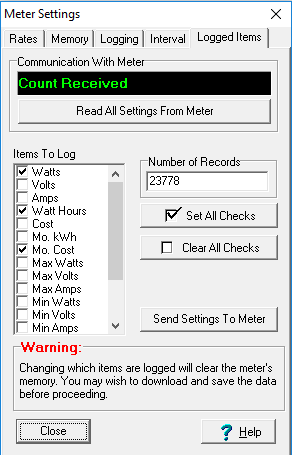
Here you can pick your parameters to log.
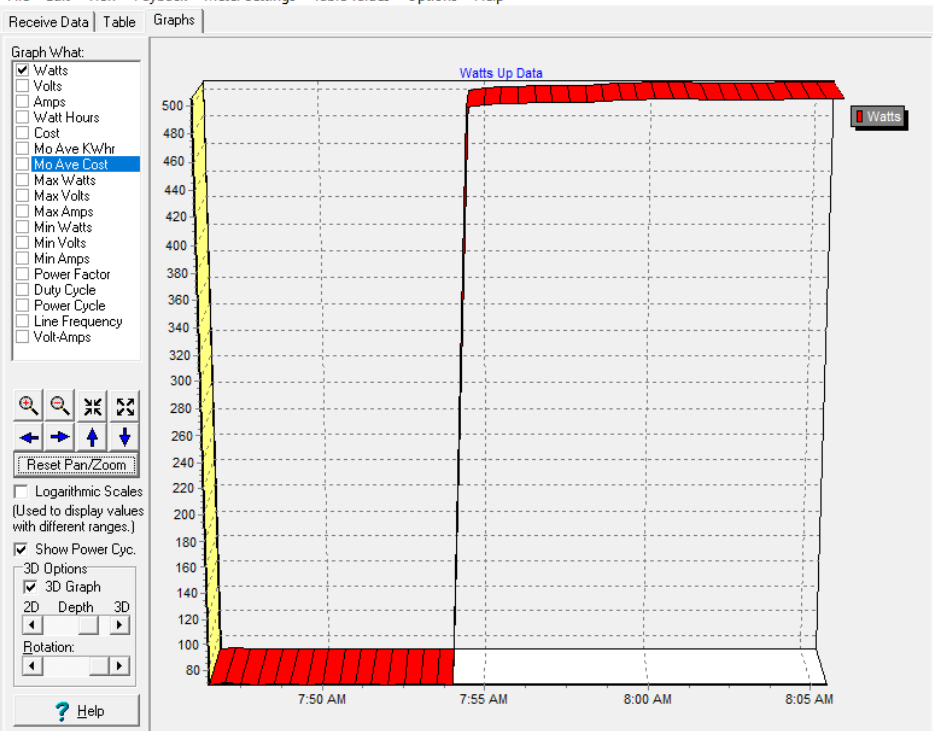
In the graph below the power meter was logging data while my Miner was idle and then I started mining some Zencash. You can see my power jump from an idle (Around 68 Watts) to around 500 Watts. You can do 3D graphs or 2D, and select which parameter you want to graph.
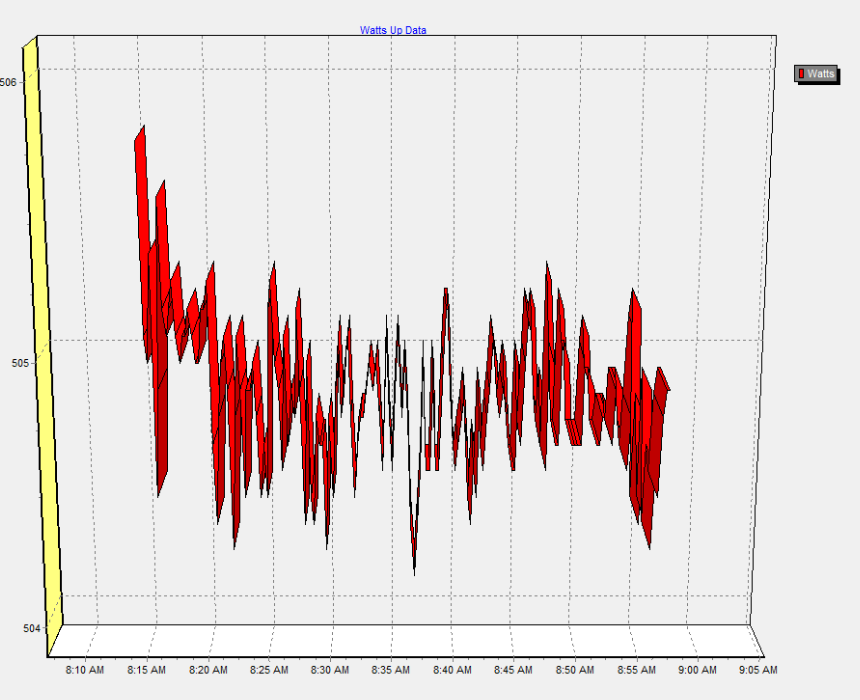
Below you can see I was running Equihash for about an hour. You can see it ranges between around 504 and 506 watts.
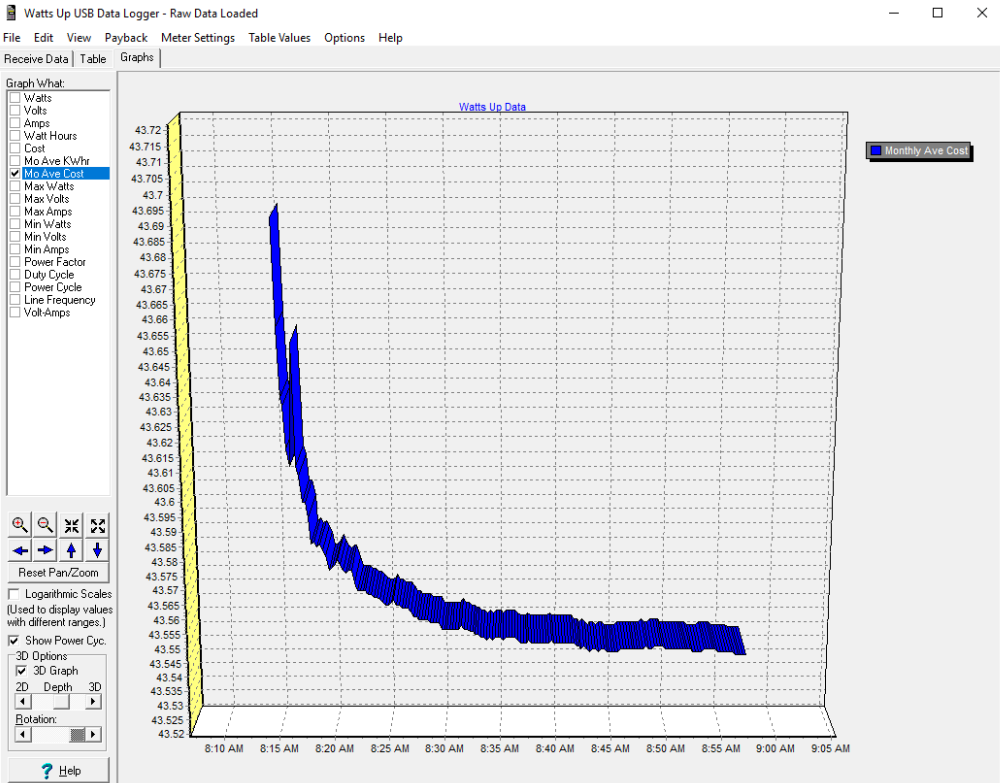
Now looking at that same data I pulled, I can graph the Average monthly cost. Around $43 bucks to keep the rig mining Equihash (Zencash).
Now you can calculate this info manually and there are also plenty of sites that have mining calculators on them. But this meter will be based off of your data and your usage. You can even graph your cumulative costs so you can see how much your current spending costs are. Possibly, shutting down your miner at a certain cost when you reach it if what I read online was correct. Pretty fancy for only 35$.
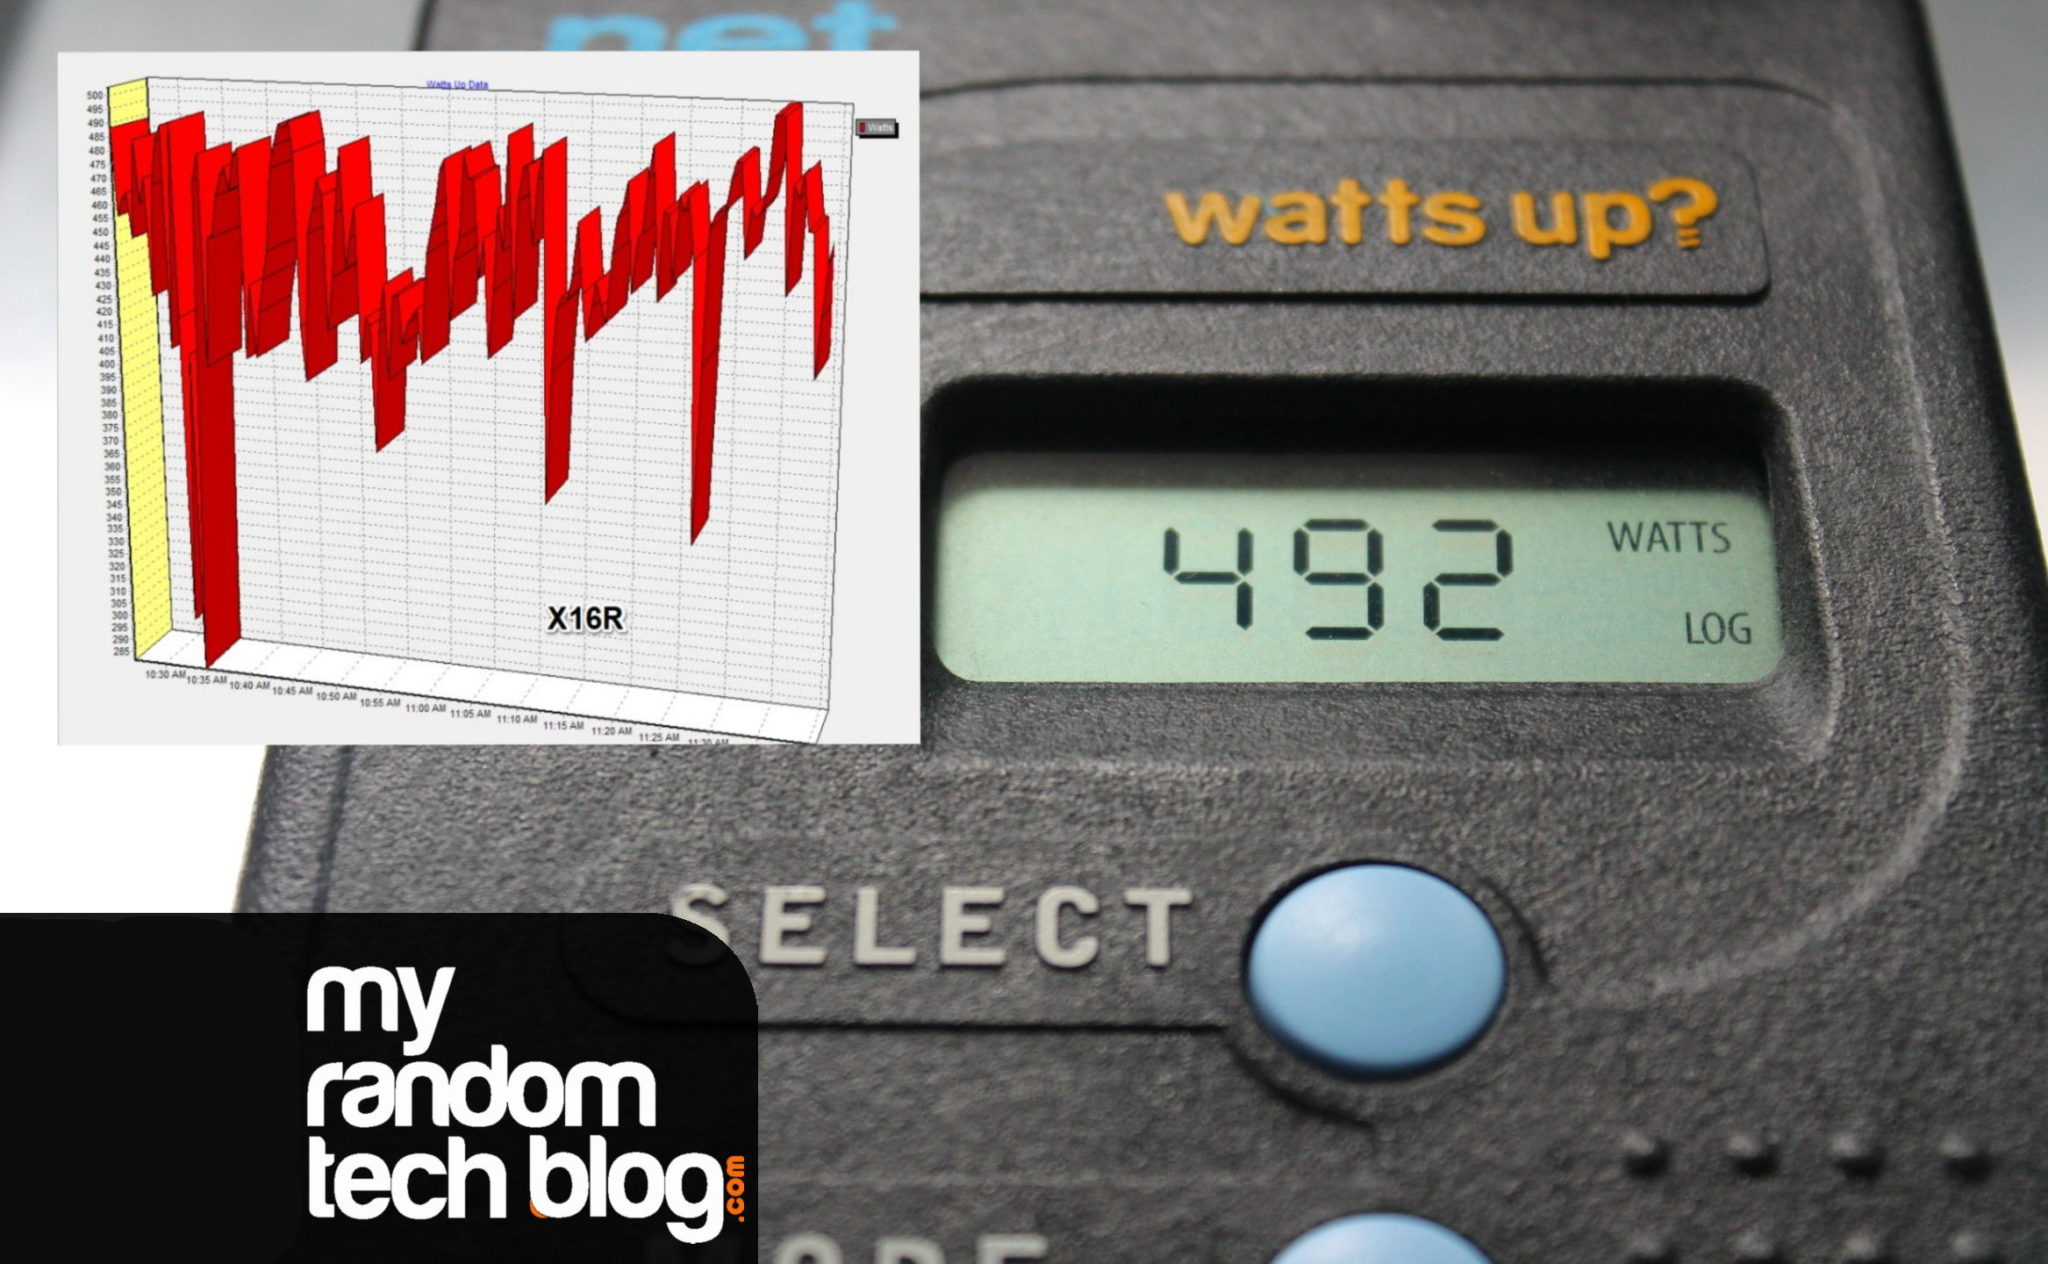
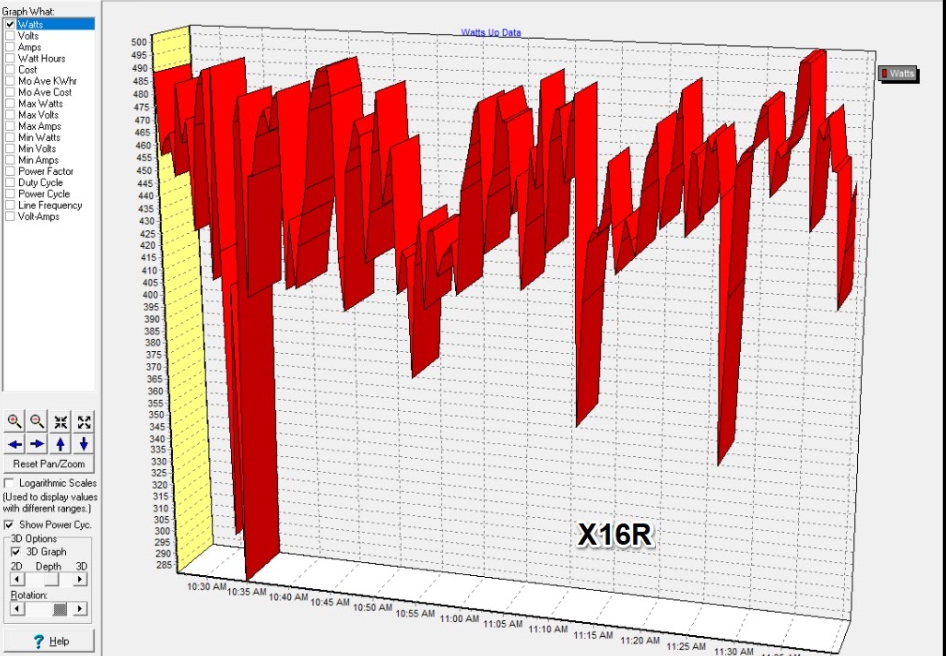
I thought this chart below was interesting. I tried running the x16r algorithm which rotates the algo based on the last hash. If you mine this algo a lot this might come in handy for tracking costs as the wattage really fluctuates. X16R had a range of 285 and 500Watts on my rig.
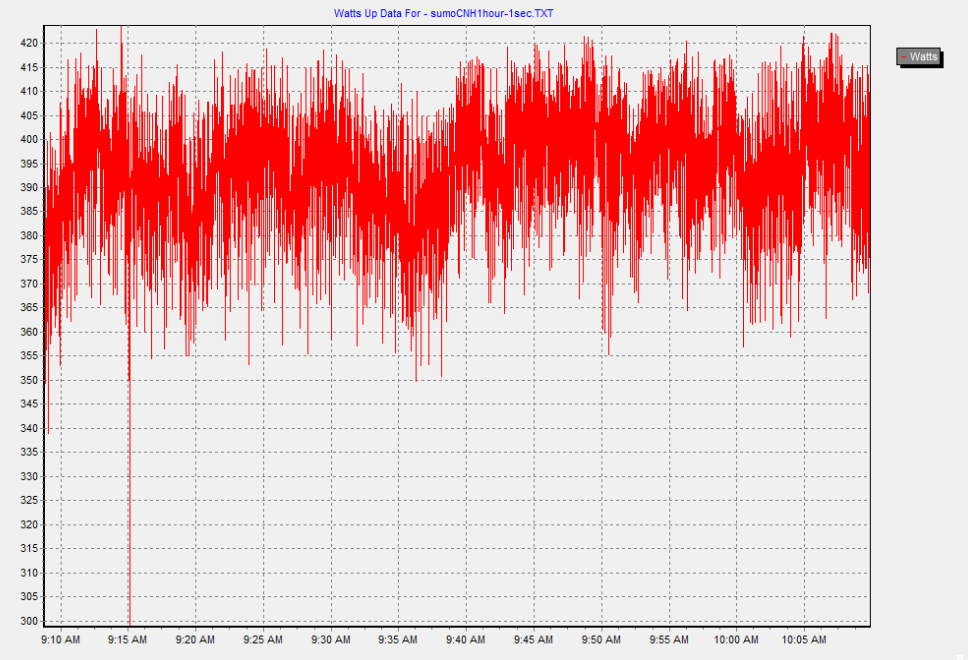
Ok, I know, not another chart, but just wanted to throw up an example of charting wattage at 1 second intervals for about an hour. This was for the same rig but this time I was mining the Cryptonight Heavy Algo (Sumokoins new algorithm). Amazing to have this level of detail for only 35 bucks.
Ok, I wont bore you with charts of my rig, but you can see that being able to log your data usage can be really useful. I better get to the summary before I put up another chart. 🙂 Seriously why do I like stuff like this. I was trying to explain to my wife how cool this was, and I didn’t get the type of response I wanted (Which I should have expected as this stuff is not really her jam.) So off to my blog to share with others who might like it.
Summary:
I plan to add more to this review soon as I play around with the meter more. I really feel like I am just scratching the surface on this meter and what it can do. Once I figure out the Webserver, the remote power switching etc I should have a lot more details. But I feel that for $35 bucks this was money well spent. I still like my Kill-A-Watt and I think its a handy tool, but the advantages of being able to log my data really makes me think these are a better option. To bad they are no longer being made. I hope it ends up being reliable and lasts me for a while. I will update this if I run into any troubles with it. One downside was it looks like you need the pro version software to be able to see it real time on my screen. Seems like they purposefully held back that feature. Maybe I can find the pro version for cheap someplace. I have not really looked yet.
While my main purpose was to track my mining rigs electrical costs. (And goof off with a new toy). I think this would be useful for others who are trying to track any power usage. If you already use one and have any cool info on it please let me know.